Track six client retention metrics: Customer Retention Rate (CRR), churn rate, Gross and Net Revenue Retention (GRR/NRR), Customer Lifetime Value (CLV), and one sentiment metric like NPS or CSAT. CRR and churn measure headcount loss, GRR/NRR isolate revenue impact including expansions, CLV projects long-term value, and sentiment metrics flag risk before it shows up in the numbers. The formulas, worked examples, and reporting cadence below turn these definitions into a working dashboard.
TL;DR:
- Revenue-weighted metrics like NRR and GRR reveal expansion success and account stability beyond simple headcount retention.
- Tracking revenue churn separately uncovers revenue loss from downgrades or frozen memberships that headcount metrics mask.
- Combining CRR with NRR and CLV provides a comprehensive view of client retention, revenue growth, and long-term value.
- Regularly measuring these metrics on a cadence aligned with contract types prevents false signals and improves intervention timing.
- Automated, connected systems like FITsociety centralize data for accurate calculations, reducing admin work and enabling proactive retention strategies.
Core Client Retention Metrics and Their Formulas at a Glance
Retention metrics fall into four groups, and mixing all four is what separates a real measurement system from a vanity dashboard.
- Logo/headcount metrics — CRR: [(End count − New customers) / Start count] × 100. Best for gyms, studios, and any recurring-membership model where headcount itself is the product.
- Revenue-weighted metrics — NRR and GRR, calculated from monthly recurring revenue (MRR). Essential for B2B SaaS and coaching businesses on tiered pricing.
- Value metrics — CLV and the CLV:CAC ratio. Useful for any business deciding how much to spend acquiring versus retaining.
- Behavioral and sentiment metrics — NPS, CSAT, repeat purchase rate, engagement frequency. Critical for e-commerce and subscription apps where churn happens quietly, one skipped login at a time.
A practical retention framework from CustomerGauge recommends combining exactly these four categories rather than leaning on any single number.
How Do You Calculate Customer Retention Rate?
CRR isolates how well you keep the clients you already had, and the formula deliberately excludes anyone acquired during the period:
CRR = [(E − N) / S] × 100, where E is the ending customer count, N is new customers added, and S is the starting count.
- Start with 100 clients, end the month with 120, and 20 are new. CRR = [(120 − 20) / 100] × 100 = 100%. You lost nobody.
- Start with 100, end with 100, and 10 are new. CRR = [(100 − 10) / 100] × 100 = 90%. Ten of your original clients quietly left, masked by ten new sign ups.
These figures come from Gainsight’s retention rate methodology, and they show why raw headcount growth can hide real attrition.
Pro Tip: Match your reporting cadence to your average contract length. Monthly CRR checks on annual contracts produce noise, not signal, while annual checks on month-to-month plans catch problems too late to fix them.
Why Does Revenue Churn Tell a Different Story Than Customer Churn?
Customer churn is the mirror image of CRR: it counts the clients you lost as a percentage of where you started. But a client can stay on your books and still cost you revenue, which is where revenue churn earns its place.
Revenue churn = (MRR lost during the period ÷ MRR at the start of the period) × 100.
Revenue churn should be tracked on a customer basis monthly or quarterly, and it deliberately excludes revenue from new customers, according to Zendesk’s retention formula guide.
- A client downgrading from a five-seat plan to two seats shows up as zero churn in CRR but real loss in revenue churn.
- A studio member who freezes their membership for two months looks retained on a headcount report but generates no revenue during that window.
- Churn percentage alone can look flat for months while revenue quietly erodes underneath it.
A high logo retention rate can mask shrinking account value. That’s exactly why Gainsight pairs headcount retention with revenue-weighted tracking rather than reporting either alone.
What’s the Difference Between GRR and NRR?
Gross Revenue Retention and Net Revenue Retention both measure revenue kept, but they answer different questions.
- GRR = revenue retained from existing customers, excluding any expansion revenue, expressed as a percentage of starting revenue. GRR caps at 100% by definition.
- NRR = the same calculation but including upsells, cross-sells, and price increases. NRR can exceed 100% when expansion revenue outpaces what you lose to downgrades and cancellations.
Experts recommend tracking both CRR and NRR/GRR side by side rather than picking one, since Onramp’s SaaS retention guidance notes that NRR above 100% signals your existing base is growing revenue faster than it’s shrinking. Publish GRR and NRR together monthly or quarterly. GRR shows how sticky your base is; NRR shows whether expansion is covering your losses.
How Do You Calculate Customer Lifetime Value?
CLV estimates the total revenue a client generates over the relationship, and the formula shifts slightly depending on your business model.
- Simple CLV = average purchase value × purchase frequency (per year) × average customer lifespan (in years). A client spending $150 per session, twice a month, over three years generates $150 × 24 × 3 = $10,800.
- Subscription CLV = average monthly revenue per client ÷ monthly churn rate. A client paying $80/month with 5% monthly churn yields $80 ÷ 0.05 = $1,600.
- CLV:CAC ratio = CLV divided by customer acquisition cost. A ratio below 3:1 usually means you’re overspending on acquisition relative to what retention is returning.
Small shifts in purchase frequency or lifespan move CLV dramatically, which is why the ratio, not the raw number, matters most when deciding how much budget to shift from acquisition into retention programs.
Which Sentiment and Behavioral Signals Predict Churn Early?
Revenue metrics tell you what already happened. Sentiment and behavior metrics tell you what’s about to happen.
NPS (Net Promoter Score) asks how likely a client is to recommend you, scored from detractors (0-6) to promoters (9-10). NPS functions as a leading indicator, surfacing churn risk before it appears in revenue numbers, according to Gainsight’s retention glossary. Always follow the score with a driver question (“What’s the main reason for your rating?”) because the number alone doesn’t tell you what to fix.
- CSAT measures satisfaction with a single interaction, useful for evaluating a coaching session or support ticket.
- CES (Customer Effort Score) flags friction in onboarding or booking flows.
- Repeat purchase rate (RPR) and login frequency (DAU/WAU/MAU) reveal disengagement before a client formally cancels.
Pro Tip: A dropoff in login frequency or session bookings, even with no complaint filed, is often the earliest churn signal you’ll get. Don’t wait for a cancellation email to act on it.
How Do Cohort Analysis and RFM Segmentation Reveal At-Risk Clients?
Averages hide the story. A cohort table, tracking retention by the month a client joined, usually shows a sharp drop right after onboarding, which is the single most fixable point in the entire client lifecycle.
- Build a simple cohort grid: rows are join months, columns are months since joining, cells show percentage retained.
- Look for the “cliff” — the month where retention drops fastest — and treat that window as your top intervention priority.
- Apply RFM scoring (Recency, Frequency, Monetary value) to sort clients into segments like Champions, At-Risk, and New.
- Trigger outreach automatically when a Champion’s recency score slips, since silence from a previously engaged client is a stronger warning than a single bad session.
Cohort and RFM analysis rank among the highest-leverage techniques for spotting exactly where retention breaks down and for measuring whether an intervention actually worked.
How Should You Choose Which Metrics to Track and How Often?
Tracking every possible metric guarantees you’ll act on none of them. Use a three-pillars rule instead.
- Pick one revenue metric — NRR for subscription and B2B models, CRR for membership-based businesses.
- Pick one behavioral metric — login frequency, session attendance, or repeat purchase rate, whichever maps most directly to your product’s actual usage.
- Pick one sentiment metric — NPS for relationship-driven businesses, CSAT for transactional ones.
Set cadence by contract rhythm: weekly for behavioral signals, monthly for revenue metrics on monthly billing, and quarterly for NRR/GRR on annual contracts. Measuring monthly for annual contracts produces false alarms, while annual checks on monthly plans respond too slowly to matter, per Gainsight’s cadence guidance.
Pro Tip: When a metric moves outside its normal range, resist the urge to react immediately. Add a qualitative layer first, a short survey or a cohort deep dive, so you’re fixing the actual cause rather than the symptom.
Treating retention like a business unit, tying member behavior to incremental revenue and ROI, also helps make the case for further investment when leadership asks why retention deserves budget — see five proven strategies to increase customer retention for practical ideas.
What Data Fields Belong on a Retention Dashboard?
Calculating CRR, revenue churn, NRR, and CLV accurately requires specific inputs, not estimates.
- Client start/end dates, active status, and MRR per client, tracked at the individual account level.
- New client additions and cancellations logged separately from downgrades and seat changes.
- Purchase frequency, average order or session value, and tenure length for CLV.
- NPS/CSAT responses tagged by client segment, not aggregated blind.
Build three dashboard views: a trend line for CRR/NRR over trailing 12 months, a revenue waterfall showing new, expansion, contraction, and churned revenue separately, and a cohort table for onboarding dropoff. Ops teams should review weekly; executives need monthly or quarterly summaries tied to revenue impact, following the tiered structure recommended in Epsilon’s loyalty-metrics framework.
How FITsociety Captures the Data Behind These Metrics
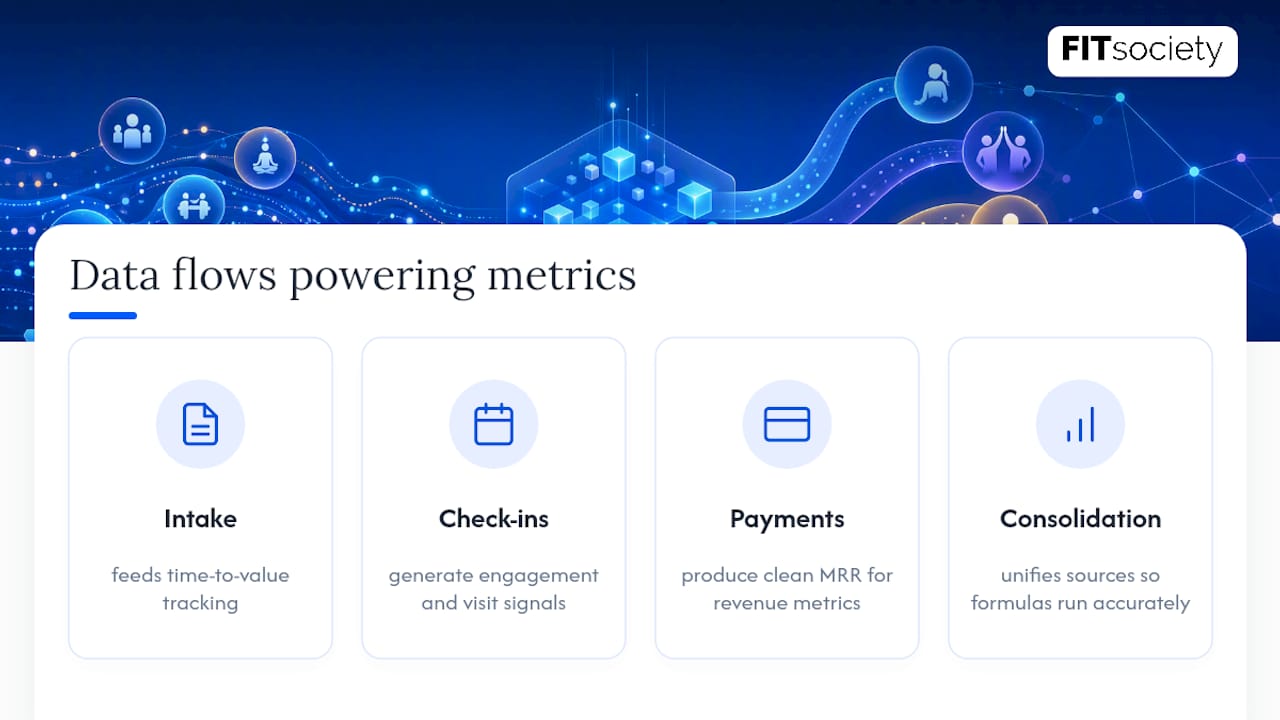
Calculating CRR, NRR, or CLV accurately depends on clean, connected data, which is usually the hardest part, not the formula. FITsociety centralizes client intake, payment records, check-ins, and engagement logs in one system built for personal trainers, online coaches, and fitness studios.
Intake forms and onboarding flows feed time-to-value tracking directly, since faster first-value sessions correlate with lower early churn. Automated check-ins and reminders generate the engagement data behind repeat-visit and login-frequency signals, while integrated payment processing produces clean MRR figures for revenue churn and NRR without manual reconciliation across separate billing tools. That consolidation is what lets a coach or studio owner actually run these formulas instead of just admiring them in a spreadsheet.
Why a Balanced Metric Set Beats Single-Metric Thinking
Businesses that anchor on one number, usually NPS or CRR alone, consistently miss the story that revenue churn or a cohort cliff would have shown them. NPS tells you sentiment; it says nothing about whether a shrinking account is about to cancel. CRR can look perfect while NRR quietly drops below 100%.
Pair every metric change with a small, measurable experiment, not a company-wide overhaul. This quarter, pick one leading indicator, fix its onboarding cliff, and measure the lift in the next cohort before touching anything else.
— Matthijs
Turn Retention Metrics Into an Automated Workflow
Some platforms replace the spreadsheet-and-multiple-tools setup most coaches use to track retention with one connected system. Client intake maps directly to onboarding and time-to-value tracking, automated check-ins generate the engagement data behind behavioral signals, and integrated payments produce clean revenue figures for churn and NRR calculations, without exporting numbers from four different apps first.

That consolidation means less admin time reconciling data and more time acting on what it shows. Coaches managing client rosters get centralized reporting instead of guessing which spreadsheet has the current numbers, and studio owners get onboarding flows built to reduce the early-cohort dropoff covered above. If you’re running a coaching practice or studio and want your retention numbers calculated automatically instead of assembled by hand each month, visit FITsociety’s platform to see how client intake, check-ins, and payments connect into one reporting system.
Sources
- How to calculate customer retention rate — Gainsight
- SaaS retention rate guidance — Onramp
- Customer retention metrics — CustomerGauge
- Loyalty-program metrics that prove program value — Epsilon
- Customer retention rate + formula — Zendesk
FAQ
What Are the Core Client Retention Metrics to Track?
The essential set is CRR, churn rate, GRR, NRR, CLV, and one sentiment metric like NPS or CSAT, combining revenue, behavioral, and sentiment data for a complete view.
What Are the Three R’s of Customer Retention?
Definitions vary across sources, but a common framing centers on Retention, Relationship, and Revenue: keeping clients, deepening engagement with them, and protecting the revenue that engagement generates.
What Are the 5 Key CX Metrics?
Most frameworks converge on CRR, NPS, CSAT, CES, and CLV, since together they cover retention, sentiment, effort, and long-term value rather than any single angle.
How Often Should I Measure Client Retention?
Cadence should match contract length: weekly for behavioral signals, monthly for revenue metrics on monthly billing, and quarterly for NRR/GRR on annual contracts, since mismatched cadence creates false alarms or delayed responses.
Can NRR Really Exceed 100%?
Yes. NRR includes expansion revenue from upsells and price increases, so when that growth outpaces losses from downgrades and cancellations, NRR climbs above 100%, a sign your existing base is expanding faster than it’s shrinking.